
SIEM & DETECTION · 11 MIN
Beyond Keep Alive: Defining Shift in a SIEM Data Pipeline
Keep alive tells you a log source is breathing, not that it is well. How our SOC engineering team watches every source against its own normal.
How do you detect a log source that has stopped sending to a SIEM?
A single global timeout fails in both directions: it alarms on sources that are quiet by design, such as a weekly vulnerability scanner, and it is far too slow for sources that should never pause, such as a firewall. The better approach judges every log source against its own expected rhythm, compares its volume against the same hour of the day over recent days rather than a daily average, and treats a blind monitoring connector as unknown rather than accusing its sources of going silent.
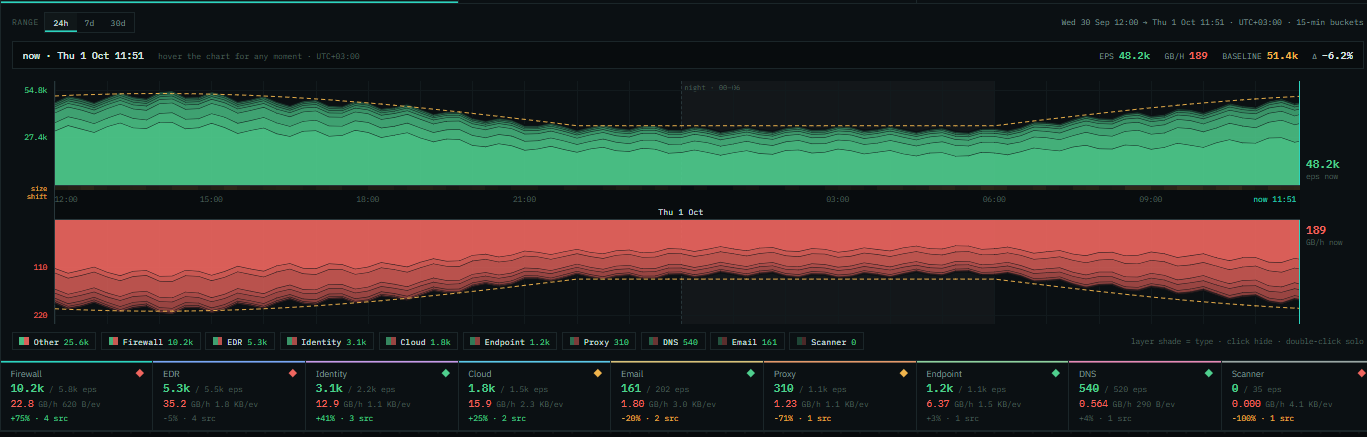
Beyond Keep Alive: Defining Shift in a SIEM Data Pipeline
Most data pipeline monitoring answers one question.
Is the source alive?
That is keep alive, and it is necessary.
It is also the least useful thing you can know about a log source.
A source can be alive and sending half of what it should.
It can be alive at three in the morning and look dead, because nobody works at three in the morning.
It can look dead because the thing watching it went blind.
We are the SOC engineering team at QMasters.
Our job is to make sure every customer's data actually reaches the SIEM, so the analysts on the floor are investigating what happened rather than what was collected.
This is how we stopped asking whether a source is alive, and started asking whether it has shifted.
The short version
The question.
Is every customer's data still flowing into our SIEM, and if not, which source broke, when, and what are we doing about it?
What keep alive gets wrong.
One global timeout is wrong in both directions at once.
Set it short and the weekly scanner pages someone every night.
Set it long and a firewall can be dark for most of a shift before anyone hears about it.
What we built instead.
A telemetry console that judges every log source against the rhythm expected of it, not against one global clock.
It compares current volume with the same hour of the day over recent days, so a quiet night is never mistaken for an outage.
It watches QRadar log sources and CrowdStrike NextGen SIEM data connections in one view.
What "define shift" means in practice.
Four dials that we set ourselves, and that every source is judged against.
How long a source may be quiet before it is silent.
How many multiples of its usual interval it may miss.
How big a move counts as a trend.
How many days of history make a baseline.
The rules it will not break.
A blind collector freezes its sources rather than accusing them of silence.
A silent source shows no number, never a fabricated minus one hundred percent.
A source dark for a month is dormant, not a fresh emergency.
A source we cannot map to a customer is counted, not hidden.
How we add new signals.
Off, then shadow, then on.
A new signal is collected and stored in shadow while the floor sees nothing different, and it reaches the analysts only once we have watched it and measured what it costs the SIEM.
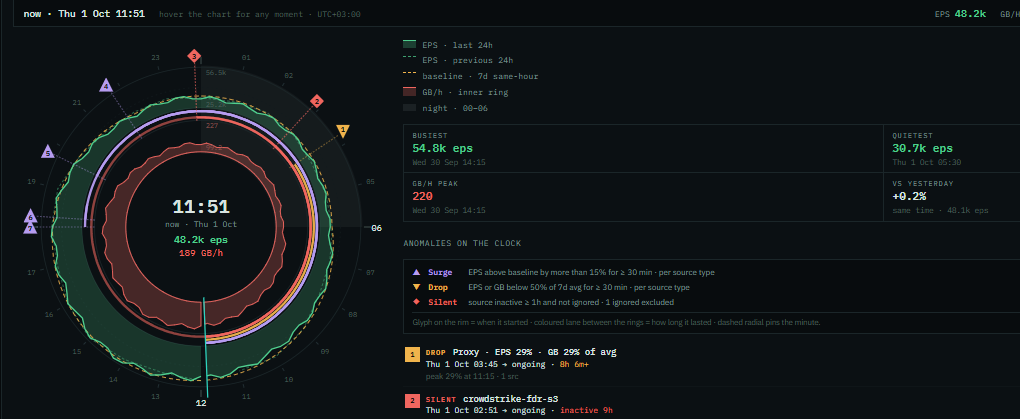
*Figure 1.
The daily clock puts event rates, data volume and anomalies on the same timeline, so the floor can see when a source shifted.
Illustrative, invented data.*
Why keep alive fails in both directions
The usual way to monitor a SIEM feed is a timeout.
If nothing has arrived for some number of hours, raise a flag.
The trouble is that log sources do not share a rhythm.
A firewall writes many times a second.
An identity provider writes whenever someone signs in.
A vulnerability scanner might run once a week, and be completely silent in between by design.
Pick any single timeout and you are wrong for most of them.
Short enough to catch the firewall, and the scanner looks broken six days out of seven.
Long enough to stop the scanner alarming, and a firewall can go dark for half a day while the dashboard stays green.
Teams usually solve this by hand.
They mute the noisy sources, raise the global threshold, and quietly accept that the threshold is now too slow for the sources that matter most.
The monitoring becomes something the floor has learned to ignore.
Every source on its own clock
So we stopped using one clock.
Every source is judged against the interval it is expected to keep.
Without better evidence, that expectation comes from what kind of source it is.
| Source type | Counts as silent after |
|---|---|
| Firewall, DNS, SIEM | 15 minutes |
| Proxy | 20 minutes |
| Identity | 1 hour |
| Cloud, Email | 2 hours |
| Endpoint, EDR | 6 hours |
| Vulnerability scanner | 8 days |
A weekly scanner quiet for five days is not silent.
A firewall quiet for twenty minutes is.
Same console, same rule, opposite answers, and both correct.
Two guard rails sit around every threshold.
Nothing is ever called silent in under fifteen minutes or over fourteen days, whatever the settings say.
And a source is never judged more finely than the console can actually observe it.
If we only poll every five minutes, we cannot prove a source went quiet in two, so the threshold never drops below three polls.
Defining shift: the same hour, not the daily average
Keep alive is binary.
Alive, or not.
Most of the trouble we chase is neither.
A source that is still sending, but sending far less than it should, is the one that hides longest, because every liveness check passes.
To see that, you need a baseline, and the baseline is where most volume monitoring goes wrong.
Log volume follows the working day.
Compare three in the morning against a daily average and every night looks like a collapse.
Compare two in the afternoon against it and every busy hour looks like an attack.
So the console compares each source with the same local hour over the trailing days, a week by default.
Three in the morning is measured against recent mornings at three.
A real drop shows up as a drop, and a quiet night shows up as a normal night.
A source too new to have earned a baseline is never judged as if it had one.
Its comparison is labelled provisional until there is enough history for that hour to stand behind.

*Source trends.
Still sending is not the same as sending normally: the console compares each source with its own baseline and explains the shift.
Illustrative, invented data.*
The four dials we set ourselves
This is what we mean by defining shift.
The thresholds are not hidden constants.
They are four settings that a team lead changes in the console, and every source's status is recomputed against them.
| Dial | What it decides | Default | Range |
|---|---|---|---|
| Silent hours | The fallback for how long a source may be quiet, when nothing better is known | 48 h | 6 to 96 h |
| Cadence multiple | How many times its usual interval a source may miss before it is overdue | 3 | 1.5 to 6 |
| Trend percent | How far from its baseline a source must move to count as a trend | 15% | 5 to 50% |
| Baseline days | How many days of the same hour make the baseline | 7 | 3 to 28 |
Two details matter more than they look.
Every dial has a hard range, and an out of range value is pulled back inside it rather than rejected.
Nobody can switch detection off by typing a strange number.
And the dials are read at the moment the console decides, not baked in.
Change the trend percent and the next view reflects it, for every source, with nothing redeployed.
Not all four do equal work today, and we would rather say so.
The trend and baseline dials visibly change what the floor sees.
The cadence multiple applies once a source has an interval of its own on record, which is not yet in force, so for now silence is judged by source type.
Silent hours only decides for a source type we have no default for, which in practice is almost never.
A blind observer is not a dark source
This is the rule we care about most, and the one that took the longest to get right.
Every source is watched through a connector: a poller that asks the SIEM what arrived.
When that connector fails, every source behind it stops reporting at once.
A naive console sees forty sources go silent at the same instant and raises forty alarms.
Nothing happened to those forty sources.
Something happened to us.
So when a connector degrades, its sources are frozen.
They keep their last known state, they are marked as frozen, and none of them is accused of silence.
The alarm goes to the connector, which is where the problem actually is.
A source that was already dark for over a month before the connector failed is still reported as dormant.
A broken observer cannot bring a long dead source back to life as merely frozen.
It is the same lesson we keep learning from different directions.
In Part II of our agentic SOC series, a search that never ran looked identical to a search that found nothing.
In our QRadar MCP post, an empty answer looked identical to a clean one.
Here, a blind console looks identical to a dark network, unless something refuses to let it.
What the console refuses to say
A few smaller rules carry the same idea.
No number is not zero.
A silent source has produced nothing to measure, so it shows no rate and no change, rather than a minus one hundred percent that would claim a measurement nobody took.
That is different from a measured zero.
A source still inside its allowance that sends nothing this window does read as minus one hundred percent, because a zero really was measured where events were expected.
Once its allowance runs out it turns silent, and the number disappears.
A day before a source first appeared is a gap in its history, not a zero.
Dormant is not silent.
A source quiet for more than thirty days is far more likely to have been retired than broken.
It is reported apart, so the count of sources needing attention is about fresh blind spots and not about old decommissions.
Emitting now beats a stale timestamp.
If a source sent events in the current window, it is alive, even if its last event field has not caught up yet.
Unmapped is counted, not hidden.
A source we cannot attribute to a customer is listed and counted on its own.
It never quietly disappears from the totals, and it never gets folded into the wrong customer.
Event volume is counted, not records.
The SIEM merges repeated events into single stored records, so counting records undercounts.
Every rate in the console is the sum of the events those records represent.
What it looks like in practice
Every example uses invented customers and invented source names.
Each status and note is the console's own output, produced by running its classification code on those invented inputs.
The firewall and the scanner
FW-EDGE-01 :: Customer A          type Firewall   last event 25m ago
  status  silent
  note    no events for 25m (expected within 15m)

VULN-SCAN-02 :: Customer B        type Scanner    last event 5d ago
  status  ok
The same rule, opposite answers.
The firewall is twenty five minutes into a fifteen minute allowance.
The scanner is five days into an eight day one.
A drop that a daily average would have hidden
PROXY-01 :: Customer C            03:00 local
  now                      21 EPS
  03:00 baseline, last 7d  36 EPS
  status  ok
  trend   down
  note    -41.7% vs 7d same-hour baseline
The proxy is still sending, so keep alive is satisfied.
But it is sending well under its usual three in the morning rate.
Against a daily average that includes the afternoon peak, three in the morning would always look low, and this real drop would have been lost in the nightly noise.
A measured zero is not the same as no data
FW-BRANCH-04 :: Customer C        12m since last event   allowance 15m
  status  ok
  trend   down
  note    -100.0% vs 7d same-hour baseline

FW-BRANCH-04 :: Customer C        20m since last event   allowance 15m
  status  silent
  note    no events for 20m (expected within 15m)
Twelve minutes in, the firewall has measurably sent nothing in a window where it normally sends a great deal, and the console says exactly that.
Eight minutes later its allowance is spent, and the claim changes from "it dropped" to "it is silent".
The percentage disappears, because there is nothing left to measure.
The collector went blind, not the sources
CONNECTOR  QRadar console, Customer D
  status  degraded
  note    collector stalled or disabled — data frozen as of 2026-09-14T06:10:00+00:00

FW-CORE-03 :: Customer D          last event 20m ago
  status  degraded   (frozen)
  note    collector degraded — collector stalled or disabled — data frozen as of 2026-09-14T06:10:00+00:00
Twenty minutes is past this firewall's allowance, and a naive console would call it silent.
This one does not, because the connector watching it stopped answering.
Every source behind that connector is frozen together, and one alarm points at the connector.
Silent, dormant and never seen
WIN-DC-02 :: Customer A           last event 41d ago
  status  dormant
  note    no events for 41d — likely decommissioned

APP-LOG-07 :: Customer B          never seen
  status  silent
  note    no events ever received (expected within 6h)
A month of silence is reported as a probable retirement, not a fresh emergency.
A source that was configured but has never sent a single event is flagged as silent from the start, rather than waiting for a timeout that has nothing to count from.
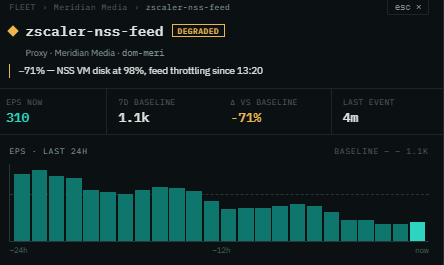
*Figure 2.
One proxy feed, its last day of traffic, its baseline, and a plain-language note explaining the degraded state.
Invented data.*
Plumbing first: off, shadow, on
Not every failure starts at a source.
Some start a level down, in the event collectors that gather logs for many sources at once.
When one of those stalls, every source behind it goes quiet together, and then, when it recovers, they all arrive in a burst as the backlog flushes through.
We replayed real pipeline incidents from our own history against the console's stored record, and it would not have flagged them clearly.
Partly that was because it had not been running for most of the hours in question.
Mostly it was because the trouble had started in the plumbing, which it was not built to see.
It measured the rate each source stored and the SIEM's own last event stamp, and neither of those shows a backlog, a stall or a collector being throttled.
So we built signals for the plumbing: a per collector stall detector that checks the collector's own heartbeat, and the SIEM's own health notifications.
This is what a collector stall reads like when the signal is on.
stalled ~20m, recovered 25m ago; its Health-Metrics heartbeat stopped too (QRadar-side); then 3.4× — consistent with a backlog flush · 5-min resolution; flush size not measured

stalled ~35m and counting (5-min resolution)

~3h behind the median EC — stored EPS is backlog drain; its sources' trends are suppressed
Look at how careful the wording is.
A burst after a stall is "consistent with a backlog flush", and the flush size is "not measured".
A collector running hours behind the others has its sources' trends suppressed, so its drained backlog is never mistaken for a surge.
These notes come from stored history and offline tests.
The detector has not yet run on the live wall.
These signals are built, and they are not yet switched on in production.
That is deliberate, and it is the part of the design we are proudest of.
Every new signal moves through three modes.
Off.
Nothing is collected.
Shadow.
Everything is collected and stored, but it appears only on an engineering status page.
The floor's views, the alert list and every trigger are exactly as they were.
On.
The signal joins the live views and can raise attention.
A signal cannot jump from off straight to on.
It has to pass through shadow first, and the move into shadow records what the extra searches cost the SIEM, so the decision to go further is made with numbers in front of us.
On top of that sit emergency switches that can only ever turn things down, never up, and every change is recorded with who made it and when.
The alert outputs follow the same discipline.
Notifications to syslog, email, chat and webhooks are built, and paused, until each step has had its own go.
As far as our records show, no alert from this console has reached a person yet.
We would rather run a signal in shadow for a while and learn that it is noisy, than switch it on and teach the floor to ignore it.
Two pipelines, one view
Our customers do not all run the same SIEM.
The console watches QRadar log sources and CrowdStrike NextGen SIEM data connections side by side, with the same honesty rules applied to both.
A CrowdStrike feed is judged by when it last delivered data and how much it delivered over the last day, never by an event rate it does not report.
Where a feed reports a volume rather than an event rate, it is shown as a volume.
Where a feed reports nothing, it shows nothing, never a made up zero.
What is not true yet
The pipeline signals and the alert outputs are built and not yet on in production, as above.
Silence is judged by source type today.
Judging each source against an interval of its own is built and not yet in force.
The baseline knows the hour of the day but not the day of the week, so a quiet weekend hour is compared with weekday hours and can read as a drop.
For its first weeks the console ran on an engineer's workstation and went down with it more than once, which is a large part of why the replay above came out the way it did.
It now runs as a supervised service on a dedicated internal server, starting from a fresh database, and at the time of writing it is waiting for its first connectors.
None of this replaces the people on the floor.
It tells them where to look, and it is honest about the places it cannot see.
What we would tell another SOC engineering team
- Stop using one timeout. It is wrong for most of your sources at the same time.
- Compare like with like. The same hour of the day, not the average of the day.
- Separate the observer from the observed. When your monitoring goes blind, say so, and do not blame the sources.
- Never print a number you did not measure. No data is not zero, and a silent source has no percentage change.
- Ship new signals in shadow. Watch them, measure what they cost, then let them speak.
See how we keep the data flowing
We built this console for our SOC engineering practice behind StrongHold MCSS, so that the data our analysts investigate is the data that was actually sent.
It is an internal tool, not a product, and it is not for sale.
If you run QRadar yourself, the checks in our QRadar SIEM audit checklist pair well with it.
If you want to see how we watch the pipeline end to end, talk to a security expert and we will walk you through it on invented data.
---
Author · QMasters SOC Engineering
Last updated · 2026-10-01
Reading time · 11 min
FAQ
Frequently asked questions.
Judge each source against its own rhythm rather than one global timeout. A firewall that is quiet for twenty minutes is a problem, while a weekly scanner quiet for five days is normal. A single timeout cannot be right for both.
Log volume follows the working day. Comparing three in the morning against a daily average makes every night look like an outage. Comparing it against three in the morning on recent days shows a real drop for what it is.
A silent source has stopped recently and is a fresh blind spot worth chasing. A source quiet for more than thirty days is far more likely to have been decommissioned, so it is reported separately and does not inflate the count of sources needing attention.
Its sources should be marked as frozen, not silent. A monitoring tool that cannot see is not evidence that the sources it watches have gone dark, and treating it as such produces a flood of false alarms at exactly the wrong moment.
Because minus one hundred percent is a measurement, and a silent source has produced nothing to measure. Showing a calculated drop where there is no data turns an absence into a fabricated fact.
ABOUT THE AUTHOR
Practitioners from the QMasters Security Operations Center. We run 24/7 monitoring, detection engineering, and incident response for organisations across regulated industries — and write here from the offense and defense work in front of us.