AI & DETECTION · 11 MIN
QRadar MCP: Read Only, and Built to Refuse to Guess
We connected AI to IBM QRadar with a read only MCP server. What it can do, what it refuses to do, and the SIEM traps it will not let an analyst miss.
What is a QRadar MCP server and how should it be built for a SOC?
A QRadar MCP server connects an AI assistant to IBM QRadar through the Model Context Protocol, so an analyst can investigate offenses, search events and pivot on addresses in plain language. For a multi tenant SOC we built ours read only, with no tools that can change QRadar and a ten minute cap on every search, and designed it to state uncertainty rather than hide it: unknown names are refused with suggestions, oversized results are kept and paged rather than silently cut, and a shared internal address is flagged as ambiguous rather than handed to one customer.
A QRadar MCP server connects an AI assistant to IBM QRadar, so an analyst can investigate an offense, search events or pivot on an address by asking in plain language.
We built one for our own investigations.
It has two rules that matter more than any feature.
It cannot change anything in QRadar.
And it is built so that an empty, partial or ambiguous answer never arrives looking like a complete one.
The second rule turned out to be most of the work.
The short version
What it is.
A small local service that exposes QRadar to an AI assistant through the Model Context Protocol, an open standard for connecting assistants to tools.
It reads through the QRadar REST API and runs Ariel searches.
We built it for our own incident work.
It is not a product and it is not for sale.
What it can do.
Investigate an offense, including the activity around it that is not part of the offense.
Search events by name rather than by id.
Pivot on an address or a user.
Work the offense queue.
Tell you when the collection pipeline has gone quiet.
What it refuses to do.
Change anything.
Run a search past ten minutes without explicit authorisation.
Return nothing for a name it does not recognise, when it could tell you the name matched nothing.
Cut a result short without saying so.
Hand a shared internal address to one customer.
When it has to guess, it says so.
It does guess in a few places, and we would rather you heard that from us.
Usernames match by contains, because the same person appears under several spellings.
A name with no exact match falls back to a partial match, and the output labels it as one.
The playbooks flag possible password sprays and scans as candidates to check, not as findings.
Why read only.
Our console is multi tenant.
On a multi tenant console, a tool that can change things is a tool that can change the wrong customer's things.
Why it matters beyond us.
A SIEM answers the question it parsed, not the question you asked, and it does so silently.
A person learns where that happens over years.
An AI assistant will not learn it at all unless the tool underneath refuses to let it through.
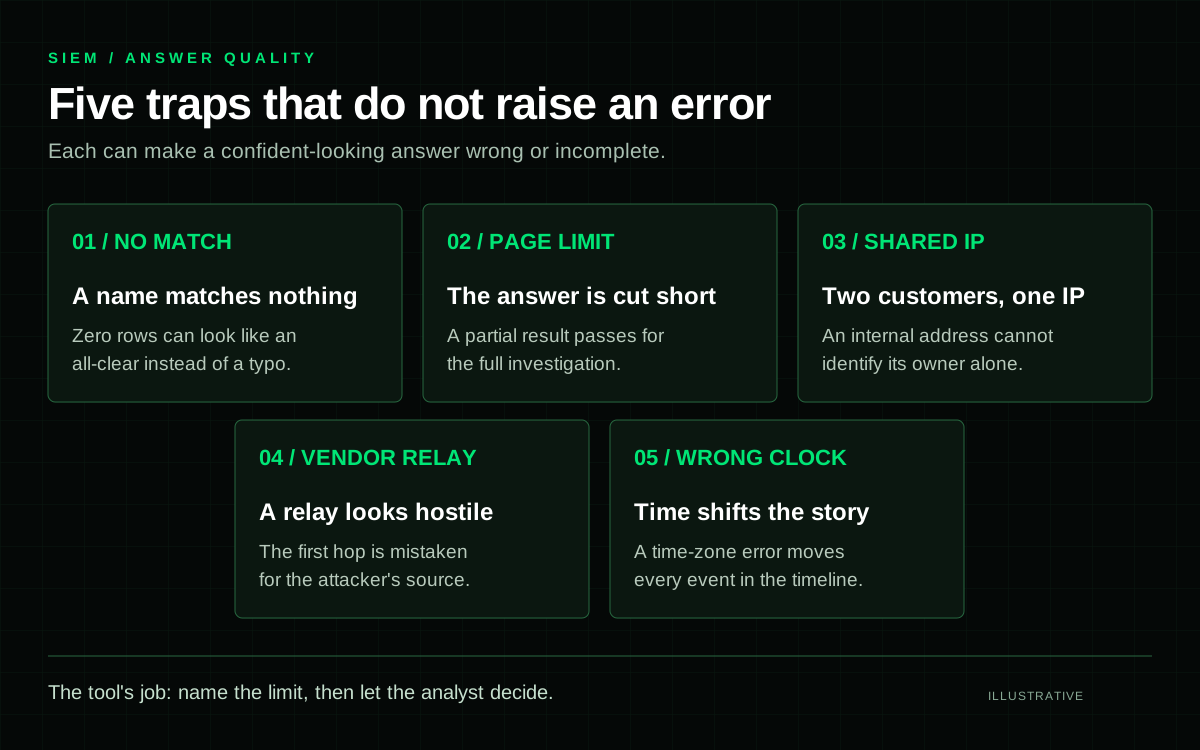
Figure 1. Five places a SIEM answer goes wrong without raising an error. Everything in the tool exists to make one of them audible. Illustrative diagram.
Why build one at all
Our analysts investigate across many customers on one console.
Much of that time is not spent on the security question.
It is spent translating it: looking up the category id behind a name, remembering that a column means something other than it says, writing the same pivots by hand again.
An AI assistant can take the translation off their hands.
But an assistant is only as good as what it is allowed to see, and how honestly that is presented to it.
In Part I of our agentic SOC series we described an internal chat with real capability behind it.
Part II explained why our investigation pipeline did not take that shape, and found that the record an agent produces can drift from what actually happened.
This post is about a chat shaped tool that does exist, which a person drives, and it applies the same finding one layer down.
The SIEM's own answers drift too.
It is not Part III.
Part III is still the blind grade.
Read only, deliberately
The server has no tools that change QRadar.
It has no tool to close, assign or annotate an offense, or to edit a rule or a reference set.
Its only calls that are not reads are the ones that create an Ariel search and delete it when it finishes.
That has a consequence worth stating plainly.
The token's permissions only decide what the tool can see, never what it can change.
An over privileged token becomes a visibility question rather than a safety one.
Three more constraints sit around every search.
A time cap on every search.
Each search stops at ten minutes unless the caller explicitly authorises a longer run, up to an hour.
A search that overruns is cancelled on the console on every exit path, so a runaway query is never left executing.
The cap is per search, so a playbook that runs many searches can take longer in total.
Nothing cut silently.
When a result is larger than one reply can carry, the output states exactly which rows it showed and keeps the search on the console so the rest can be paged.
If the query sorted oldest first, it warns that the rows cut off are the newest ones.
An audit line for every call.
Every search and every tool call is written to a local log with its arguments, its outcome and the time it took.
The token is never written.
The audit trail proves which searches were actually issued, which is exactly the property Part II found missing from its pipeline's own record.
We test the read only promise rather than trusting it.
The offline test suite runs against a fake console that fails the run if any test sends anything other than a read, a search creation or a search deletion.
If a future change ever adds a write, the suite stops passing.
A different design, for a different job
IBM engineers have published an open source QRadar MCP server under the Apache 2.0 licence.
It is broad by design: 83 tools that span the REST API, reads and writes alike, so an agent can close an offense or update a reference set as readily as it can search.
IBM describes it as an open source project rather than a supported IBM product, built to let AI agents work with QRadar and speed up SOC operations.
We read it closely while designing ours.
Several of our tools exist because it showed us which endpoints could carry them: the offense filters, the lookup from an address to its offenses, and the address enrichment.
Ours is an independent implementation with a narrower goal.
An MSSP analyst does not need coverage of the whole API.
They need an instrument that behaves predictably when the answer is empty, oversized or ambiguous, and that cannot change anything on a console many customers share.
That is a difference of purpose, not of quality.
If you are automating your own QRadar, IBM's server is a natural place to start.
What the console taught us
These are the traps the tool is built around.
Each returns a wrong or empty answer without raising an error, which is what makes them dangerous for a person and worse for an assistant.
All of them were measured on QRadar 7.5.0.
If you run QRadar yourself, they belong next to the checks in our QRadar SIEM audit checklist.
*COUNT() is not event volume.**
QRadar coalesces repeated events into one stored record.
COUNT(*) counts records, so it undercounts, by an amount that varies enormously between log source types and that you therefore cannot correct for.
Event volume is SUM(eventcount).
isCREEvent does not mean "matched a rule".
It marks events the Custom Rule Engine generated.
Events that matched a rule are found through creEventList, which holds the ids of every rule each event matched.
The useful side effect is that isCREEvent = 'false' cleanly separates what a user actually did from the alerts written about them.
Name filters are not slow, but typos are fatal.
A common belief is that decoding a name in a WHERE clause forces a full scan.
We measured it with Ariel's own count of records read, and a category filter by name read exactly as many records as the same filter by id.
The real risk is a misspelled or partial name that matches nothing and returns zero rows that look like a clean result.
creEventList is a list of numbers, not text.
Comparing it to a string is rejected outright.
Filter it by id, or through RULENAME(creEventList) when you want a name.
DATEFORMAT shows console local time with no time zone.
A timestamp read beside another system can be hours off with nothing to say so.
The tool shows UTC wherever a person reads a time.
Private addresses overlap between customers.
On a multi tenant console the same internal address can sit inside several customers' network definitions at once, and appear in more than one customer's offenses.
An internal address on its own names nobody.
Ariel windows select by storage time, not arrival time.
A backlogged collector stores events it received hours earlier.
A timeline built on arrival time quietly loses them unless something counts and reports them.
What it looks like in practice
Every example below uses invented data.
The customers, people, hosts, offense ids, rule names and hashes are made up, and the addresses come from the ranges reserved for documentation.
The wording of each response is the tool's real wording, shown as it prints.
A name that does not exist is refused
An analyst asks for firewall denies, and the assistant misspells the category.
A plain search would come back empty, and an empty result reads like good news.
Analyst: Firewall denies at Customer B from 203.0.113.0/24, last six hours.

search_events(customer="Customer B", category_name="Firewal Deny",
              ip="203.0.113.0/24", last_hours=6)

Refused: category_name='Firewal Deny' matches no category. Did you mean:
Firewall Deny? (lookup_catalog lists names)
The search never runs.
A hand written query runs, and the zero is explained
When an analyst writes their own AQL, the tool runs it exactly as written.
It refuses nothing here.
It annotates.
Analyst: Run this AQL:
SELECT COUNT(*) AS hits FROM events
WHERE domainid = 12 AND CATEGORYNAME(category) = 'Firewall Denied'
LAST 24 HOURS

hits
0

AQL advisor (suggestions only - the query ran as written):
- CATEGORYNAME(category) = 'Firewall Denied' matches no known category -
  this filter can only return nothing. Did you mean: Firewall Deny;
  Firewall Permit; Access Denied?
- COUNT(*) counts stored records; coalescing merges repeated events into
  one record, so for event volume use SUM(eventcount).
Two traps in one short query.
The zero was never a quiet day.
It was a name nobody had, counted the wrong way.
An offense, with the activity around it
This is the investigation playbook.
It is long, so the output below is trimmed where marked.
Analyst: Investigate offense 20481.

Investigation - offense 20481 (OPEN): EDR Detection Without Remediation
containing Malware Detected | customer Customer B | window 2026-09-20 06:10
-> 2026-09-20 11:42 UTC (first event - 2 h .. last event + 2 h) | 3 events

Related activity: the offense's key 203.0.113.40 is source = destination on
1,240 events of EDR Cloud Feed :: Customer B, with 61 users behind it - a
vendor relay, not the actor - not searched.
The offense's own counter says 4 events; INOFFENSE returned 3 in this
window - the tables count what INOFFENSE returns.

## What the raw logs say (digest of all 3 of the offense's own raw logs)
field     | values
title     | Trojan.Synthetic.Gen ×3
action    | Detect ×3
user      | r.okonkwo ×3
host      | LT-OKONKWO-02 ×3
source_ip | 192.0.2.77 ×3
file      | invoice_0925.pdf.exe ×2; helper_setup.exe ×1
mitre     | T1204.002 ×3

## Detection history (same rule, same customer, last 30 days)
41 offense(s) from this rule for this customer in the last 30 days: 6 open,
35 closed (closed as: Non-Issue 31; False-Positive, Tuned 4).

## Related activity outside the offense (same padded window)
- user 'r.okonkwo': 96 events outside the offense (activity 94, detections 2)
- IP 192.0.2.77: 1,204 events outside the offense (activity 1,204, detections 0)
- host 'LT-OKONKWO-02' (payload text): nothing outside the offense in this window.
[...]

## Data quality
- EDR Cloud Feed :: Customer B: device time is 2 h behind the time QRadar
  received the event, on every event - the feed's time zone is parsed
  wrongly, so anything that reports or correlates on device time is
  shifted 2 h.

Next steps:
- get_offense_events(offense_id=20481, include_payload=True)
- investigate(user='r.okonkwo', domain_id=14)
- find_offenses_by_ip(ip='192.0.2.77', domain_id=14)
Five things in that reply would each have cost an analyst time, and none of them is the verdict.
The offense's own key turns out to be an address the vendor's feed stamps on its events, shared by dozens of users.
The tool says so and does not waste a search on it.
The real endpoint address appears only inside the raw logs, and that is the one the next steps pivot on.
The window is padded two hours either side, and the related search looks deliberately outside the offense.
An offense is a boxed view of what one rule caught, and the interesting part of an intrusion is often what sits next to it.
The detection history puts the offense in context before anyone reads a log.
Thirty five of the last forty one were closed, most as not an issue, which changes how the next one is read.
QRadar's own event counter and the events it will actually return disagree, and the tool states the difference rather than choosing one silently.
And the feed's clock is two hours off on every event, which is a parsing error, not an attacker.
Anything correlating on device time, including behaviour analytics comparing where a user signed in from, was quietly wrong until someone noticed.
The related activity is bounded by design.
It runs a handful of pivots, not a search of everything around the offense, and the digest reads up to a row limit that it reports when reached.
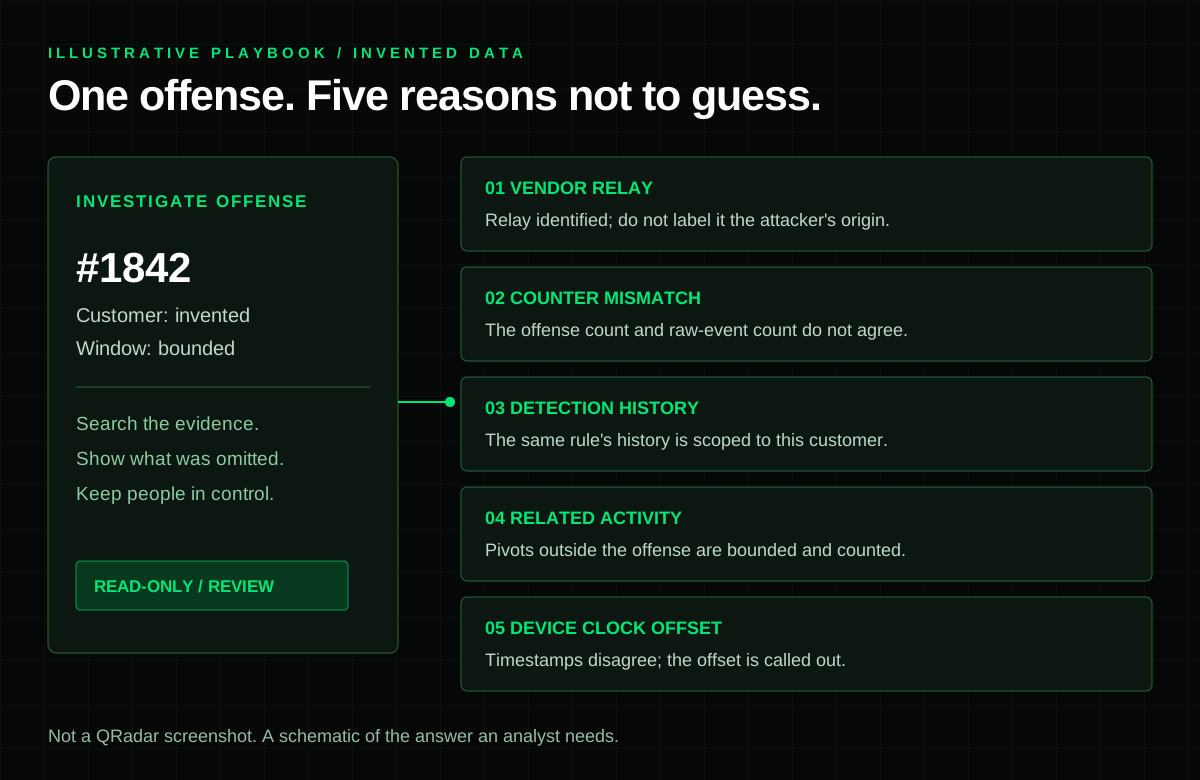
Figure 2. One offense, one reply, and every line where the tool declined to guess. Invented data throughout.
A scan that was really the firewall
Some devices log their own address as the source of traffic they handle.
Without context, the firewall looks like the loudest scanner on the network.
Analyst: Any scans in Customer A's firewall denies, last six hours?

Possible scan from 10.12.0.1: 1,020 ports on 4 targets, 88,410 denies.
Note: 10.12.0.1 is the log source 'FW-EDGE-01' itself - a device that logs
its own address as the source (NAT, locally generated traffic) is usually
not the actor.
Possible scan from 192.0.2.140: 311 ports on 2 targets, 2,904 denies.
The first candidate is the firewall talking about itself.
The second is the one worth a look, and it would have been buried under the first.
An address that belongs to two customers
Analyst: Who is 192.0.2.25?

192.0.2.25: private | most specific network Customer A/Servers/DC-LAN
(192.0.2.0/24) | AMBIGUOUS: 2 customers have equally specific networks
(/24) - pass domain_id | 2 asset(s) in Customer A, Customer B
Two customers define the same range at the same precision.
The summary names the first match it lists, then flags the tie as ambiguous and asks which customer is meant.
Naming the customer in the next question resolves it.
A collector that went quiet
Analyst: Is Customer C's firewall feed healthy over the last three hours?

EPS timeline - domain 21 (Customer C), log source 3319, last 3h | median
142.0 EPS | 1 gap(s)

GAPS - runs of >= 3 min below 25% of the median (8,520 events/min):
- 10:31-10:49 local (08:31-08:49 UTC): 18 min, received 1,930 vs ~153,360
  expected (deficit ~151,430); catch-up burst 96,400 events at 10:50 local
  (surplus ~140,900) -> backlog flushed, net shortfall ~10,530
The last 2 complete minute(s) read low - possibly Ariel write lag, not
reported as a gap; re-check in a few minutes.
An eighteen minute stall, followed by a burst as the collector flushed its backlog.
The tool reads the burst as a flush, which is an inference, and it says how much never arrived.
It also refuses to call the last two minutes a new outage, because Ariel is usually still writing them.
What we got wrong along the way
This tool did not start out honest.
It got that way through its own failures.
Our first gap detector reported zero gaps during a total blackout.
It flagged a minute as a gap when it fell well below the median.
When a feed went completely silent for most of the window, the median itself was zero, and nothing could fall below it.
A total outage read as a quiet, healthy feed.
It now reports a blackout as a gap.
A customer scoped lookup once listed another customer's offense.
One customer's address record in QRadar can reference an offense that belongs to someone else.
Our lookup trusted the record, and for a while a question scoped to one customer could return a row from another.
We found it in our own testing and fixed it, and the output now states how many referenced offenses it left out.
Both are the same failure the rest of this post is about.
A confident answer, with nothing in it to show it was wrong.
Where the data goes
Tool output is SIEM data: customer addresses, usernames, hostnames and raw logs.
It reaches the model provider for inference like anything else in the conversation.
So we treat the chat with the same care as the console itself.
The local name catalog and the audit trail both hold customer names and addresses.
They stay on the analyst's machine and out of every repository.
What is not true yet
We have not measured how good its investigations are.
The playbooks label their findings as candidates to check for exactly that reason, and a person makes every call.
After Part II we are not going to claim quality we have not graded.
It is an internal instrument, not a supported product, and nothing about it is offered to customers today.
Five questions to ask any AI on your SIEM
If someone is selling you an AI assistant for your SIEM, these five questions sort the careful ones from the rest.
- What happens when a name I use does not exist? Silence and zero rows is the wrong answer.
- What happens when the answer is bigger than one reply? You should be told what was left out and how to get it.
- What happens when two customers share an address? It should say so, not pick one.
- What happens when an address belongs to the vendor, not the attacker? It should be flagged before anyone pivots on it.
- What happens when the timestamps disagree? A whole hour offset on every event is a parsing error, and it should be named as one.
See how our SOC investigates
At QMasters, this is an internal tool we built for our own investigations inside StrongHold MCSS, alongside the IBM QRadar deployments we run for our customers.
It is not for sale.
If you want to see how an investigation actually runs, with the tool, the playbooks and the analyst deciding what matters, talk to a security expert and we will walk you through one on invented data.
FAQ
Frequently asked questions.
It is a small service that exposes IBM QRadar to an AI assistant through the Model Context Protocol, an open standard for connecting assistants to tools. The assistant calls its tools to list offenses, run Ariel searches and look up rules, and the analyst works in plain language instead of writing AQL by hand.
No. Ours has no write tools. Its only calls that are not reads are the ones that create and delete its own Ariel searches, so even an over privileged token only widens what it can see, never what it can change.
QRadar coalesces repeated events into a single stored record. COUNT(*) counts stored records, so it undercounts event volume, and by very different amounts depending on the log source type. SUM(eventcount) adds up the events each record represents.
Not in our measurements on QRadar 7.5.0. A category filter by name read the same number of records as the same filter by id, and QIDNAME, LOGSOURCENAME and RULENAME behaved the same way. The real risk of a name filter is a typo or partial name that silently matches nothing.
Tool output is SIEM data, including addresses, usernames, hostnames and raw logs, and it reaches the model provider for inference like anything else in the conversation. That is why the chat has to be treated with the same care as the console itself.
ABOUT THE AUTHOR
Practitioners from the QMasters Security Operations Center. We run 24/7 monitoring, detection engineering, and incident response for organisations across regulated industries — and write here from the offense and defense work in front of us.