SIEM & DETECTION · 12 MIN
Risk Observatory: The Risk That Never Raised an Offense
A capability we are building to investigate risky activity that never raised a QRadar offense, with evidence, business context and a clear next check.
How do you investigate risky security activity that never triggered a SIEM offense?
Risk Observatory is a capability QMasters is developing to help SOC analysts and customers investigate activity that deserves attention, including activity that never produced a QRadar offense. It keeps each observation connected to its evidence, its possible explanations, its unanswered questions and its decision history. It assesses potential impact, confidence in abuse, evidence coverage, authorization, review priority and disposition as separate dimensions, so a sensitive action can be urgent to review without being called malicious. Processing in the pilot is deterministic and inspectable. Risk Observatory is in active development, with a local investigation pilot for sensitive identity activity and a design prototype that uses fictional data.
Risk Observatory: The Risk That Never Raised an Offense
By Gregori Nazarovsky, Cofounder & CTO, QMasters
A sensitive identity change may be legitimate administration.
A service account reaching more machines may be an approved deployment.
A transfer involving an important system may be an expected business process.
Each one can also be the start of a serious security incident.
And none of them has to raise a single SIEM offense.
Telling the difference takes context, careful interpretation and evidence you can trace back to its source.
That is the work Risk Observatory is built to organize.
Risk Observatory is a capability we are developing to help our SOC and our customers investigate activity that deserves attention, including activity that never produced a QRadar offense.
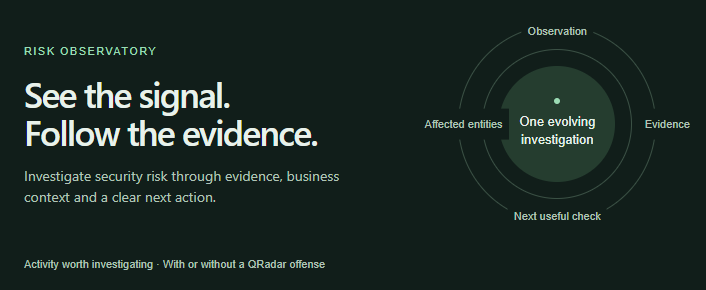
It brings the observation, the affected entities, the available evidence and the next useful check into one investigation that develops as the evidence does.
*Risk Observatory is a future capability in active development.
Today the work includes a local investigation pilot and an interactive design prototype.
The broader experience described here is the direction we are building toward, and production integrations and operating controls are still to be validated.
The screens shown use fictional data.*
The short version
The question it answers.
What would help an analyst tell a legitimate explanation from abuse, in this particular case?
Answering that means reading audit records, identifying who acted and what was affected, checking history, understanding which systems matter and finding out whether the action was authorized.
How it works.
Every investigation follows one loop: Observe → Compare → Assess → Plan checks → Verify → Reassess.
The observation stays connected to its evidence, its possible explanations, its open questions and its decision history.
What makes it different.
Impact, confidence in abuse, evidence coverage, authorization, review priority and disposition are scored as separate dimensions, so a sensitive action can be urgent to review without being called malicious.
Business context comes from a customer maintained crown jewel register.
Processing in the pilot is deterministic, so an analyst can see which evidence and which rules produced an assessment.
Where it stands.
A local pilot covers sensitive identity activity.
A design prototype shows the wider workspace on fictional data.
This is a development direction, not a dated release.
Why we are building it
The starting point is a practical question.
What would help an analyst distinguish a legitimate explanation from abuse in this particular case?
Answering it takes several separate activities.
The analyst inspects audit records, identifies the initiating actor and the affected target, reviews earlier activity, weighs the importance of the systems involved and checks whether the action was authorized.
The analyst also needs to know which sources are missing, and whether one more check would materially change the assessment.
We want Risk Observatory to organize that work.
An observation stays connected to its evidence, its possible explanations, its unanswered questions and its decision history.
As more information arrives, the same investigation can become more concerning, gain a supported legitimate explanation, or remain unresolved for a clearly stated reason.
That is what we mean by risk observability: visibility into potentially important activity, the context that gives it meaning, and the way our understanding changes as we investigate.
The intended benefit is more consistent investigation and less repeated context gathering.
We will measure both through pilot use and analyst feedback.
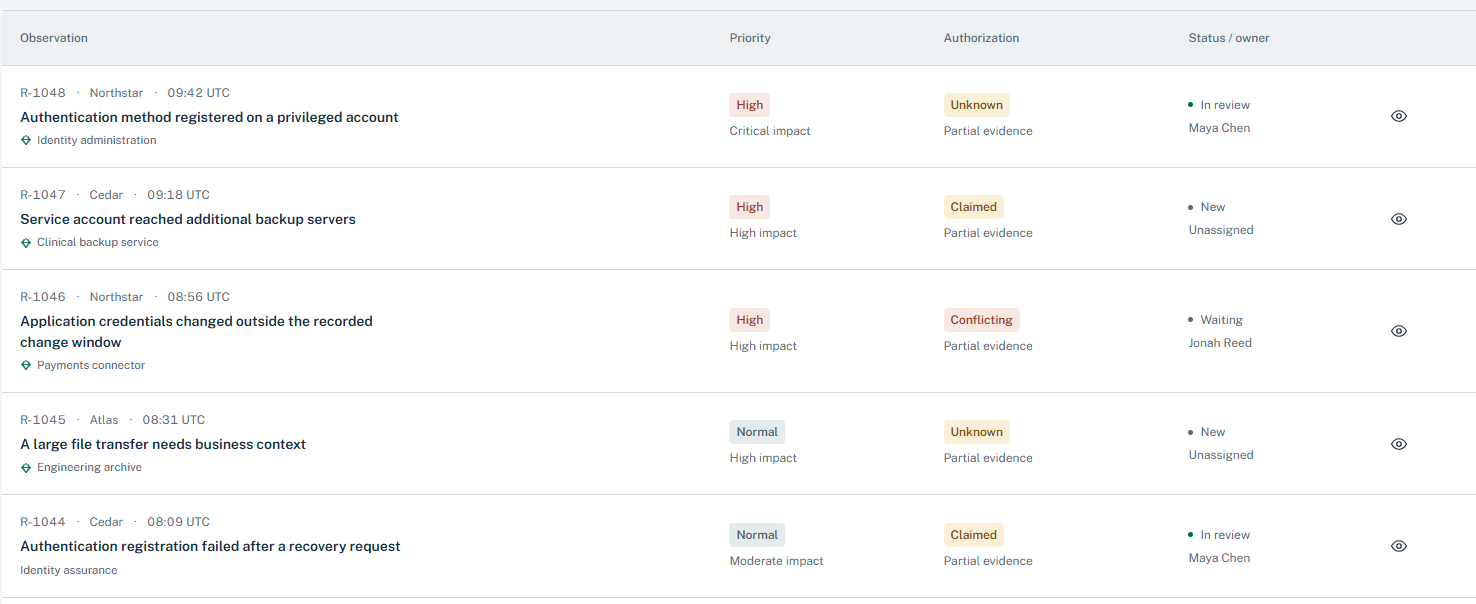
*Figure 1.
Risk Observatory observations board: priority, authorization and investigation status. All displayed customers and evidence are fictional.*
An investigation that develops with the evidence
The core process is a loop.
Observe → Compare → Assess → Plan checks → Verify → Reassess
We begin with what the source records actually establish: an operation, the initiating actor where known, an affected subject or system, a time and an outcome.
The investigation then considers why that activity may matter, and which explanations deserve examination.
Historical comparison is part of the planned capability, but it needs a defensible basis.
"First observed" has to mean first observed within a defined period of available, usable history.
A new data source, an outage or a parsing change can make familiar activity look new.
And repeated behavior does not establish approval.
So the assessment keeps several dimensions apart.
- Potential impact: what access, service or information could be affected.
- Confidence in abuse: how strongly the evidence supports a malicious or unauthorized explanation.
- Evidence coverage: what was available, incomplete, missing or unreliable.
- Authorization: whether a trustworthy approval matches the actor, action, target, scope and time.
- Review priority: how urgently an analyst should examine the observation.
- Disposition: the conclusion, or the unresolved state, the analyst has recorded.
A sensitive action can carry high potential impact while confidence in abuse stays low.
Keeping the dimensions visible explains why something deserves attention without overstating what is known.
The next check should address one specific uncertainty.
Its result may strengthen the concern, support an expected explanation or expose another gap.
Reassessment preserves why the conclusion changed, so the next analyst can follow the reasoning.
Three kinds of permission answer three different questions.
Technical permission says an account had the rights to act.
Business authorization says that particular use was approved.
And Risk Observatory itself needs permission to query the evidence source before it can verify anything.
Future checks could draw on directory ownership, change approvals or endpoint security evidence.
Endpoint context helps only where a trustworthy relationship ties the activity to the endpoint, and a shared network address alone does not establish that.
When a required source or connection is unavailable, the unresolved question stays explicit.
The workspace we are designing
We have chosen a combined interface: an Operations Board with a Risk Atlas entity map.
It puts the work an analyst has to do next to the relationships that explain the observation.
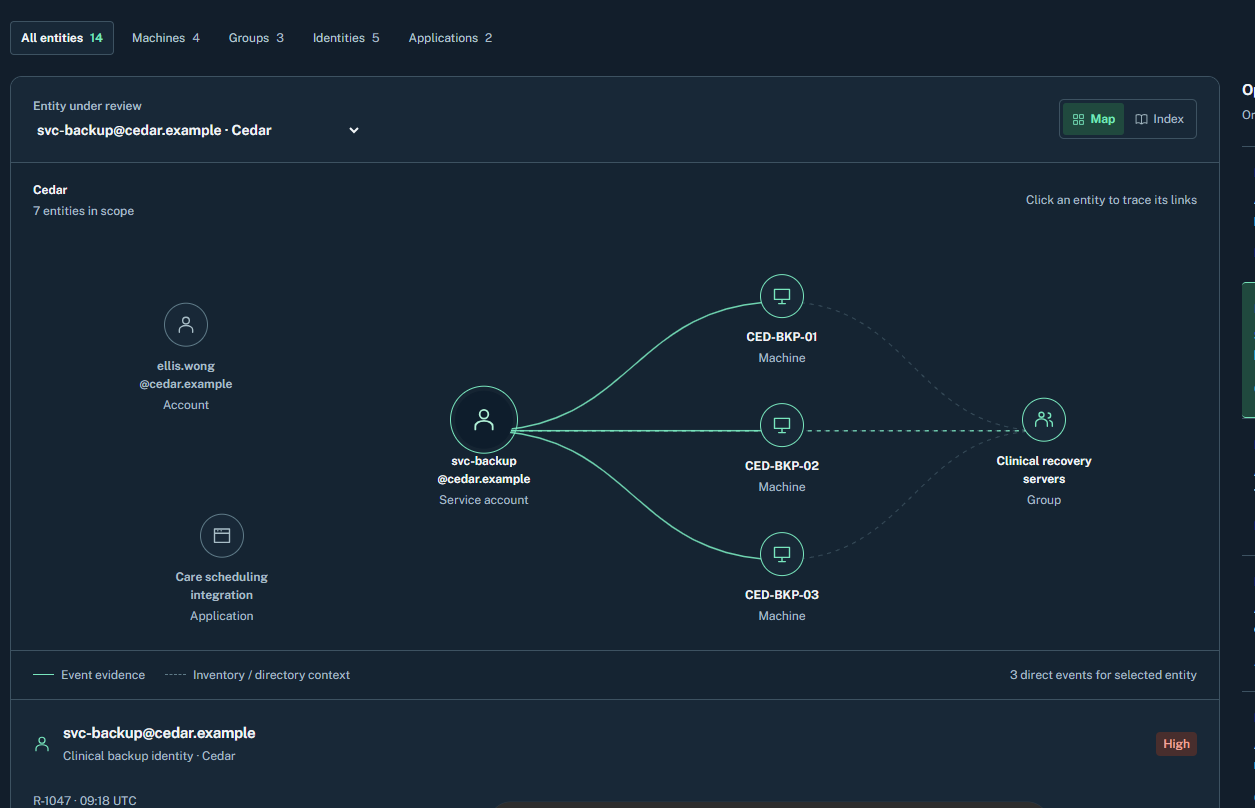
*Figure 2.
The current design prototype: the selected observation and the next analyst action sit beside the entity map.
All displayed customers and evidence are fictional.*
The Board places the selected observation and its named next action beside the map.
The analyst reads what was observed, inspects the unresolved question and moves straight to the scope of the next check.
The map connects the relevant accounts, service accounts, machines, groups and applications.
Selecting an observation updates its entity context.
Selecting an entity opens its observation and supporting records.
Customer scope, time windows, search and entity type filters narrow the view.
The design separates a relationship backed by an event from inventory or directory context.
A record of an account logging on to a machine means something different from a record that the machine belongs to a recovery group.
A group can matter to an investigation without a direct event of its own.
Association must stay separate from any claim of compromise.
Supporting connections and retained event records stay available as text and tables.
That way analysts can inspect provenance without depending on the graph alone.
Visibility into the system itself
A second dashboard shows what Risk Observatory itself is doing: which processing stages finished, which checks are waiting, which sources are unavailable and where collection or interpretation hit a limit.
We want users to tell a completed process from a completed investigation.
A query can finish while approval remains unknown.
A recent run can return old data.
An empty result can reflect limited coverage rather than absence.
The planned system activity view brings execution history, source readiness, unresolved checks and operating limits together.
It should help analysts understand their evidence, and help administrators chase gaps in the service.
How we expect to use it during a SOC shift
Take an illustrative observation.
A service account tied to clinical backups has logged on to three servers, and the authorized scope is unclear.
The analyst selects the customer and reviews the observation on the Board.
The map shows the account, the machines involved and their relationship to a recovery group.
The evidence panel shows which connections have direct event support.
The business context explains why the account matters: it supports the recovery of important systems.
That justifies a prompt review, while the question of abuse stays open.
Then the analyst works the uncertainty.
Was this part of an approved rollout?
Does the available history show these connections are unusual?
Are all three servers inside the expected scope?
Risk Observatory presents the next useful check with its purpose and its boundaries.
Depending on what is available for that customer, the check might inspect retained evidence, run an approved and bounded source query, or request an attributable confirmation from the responsible owner.
If an approval matches the account, the targets, the operation and the time, the analyst records the supported explanation.
Contradicting execution evidence would still need attention.
If only part of the scope is explained, the remaining question stays visible.
If the evidence cannot be obtained, the investigation stays unresolved, with the reason stated.
At handover, the next analyst sees the observation, the checks already attempted, the evidence received, the current assessment, the responsible owner and the open question.
The shared workspace is meant to carry that continuity across people and shifts.
The first investigation areas
The first scenarios test different kinds of reasoning and different outcomes.
Sensitive identity activity.
Authentication registration and method changes need precise interpretation.
The workflow has to tell a started operation from a completed change, a failure and a generic account update, and keep the initiating identity separate from the affected user.
A legitimate recovery or enrollment stays on the table as an explanation to examine.
The local pilot focuses on this area today.
Service account activity across machines.
This planned workflow looks at changes in where an account operates, the importance of the targets and the scope of an expected deployment.
Useful comparison depends on adequate history, and authorization depends on an appropriate approval source.
Transfers involving important information or systems.
This planned workflow asks whether a transfer is explained by its purpose, its destination and its approved scope.
Network metadata alone can leave file contents, endpoint execution or authorization unresolved, and the investigation keeps those limits.
The service account and data movement workflows are currently content drafts and demonstration scenarios.
Turning them into executable customer workflows takes source mapping, implementation and validation.
Connecting security activity to business importance
The same technical action can carry very different consequences depending on the account or system involved.
Risk Observatory is meant to make that visible through a shared crown jewel register: a customer maintained record of important assets, identities and services, and the reasons they matter.
An entry might name a backup service, an account with privileged control or an application that supports payments.
Its value comes from the explanation of business consequence, the technical identifiers and an accountable owner.
Our direction is to reuse the existing QMasters business context register through a supported integration.
Changes, source revisions and review status stay traceable.
A customer's declaration of importance shapes how impact is read, while staying separate from the confidence that an action was abusive.
Personal watchlists serve a different purpose.
An analyst may want to follow an entity during an investigation, or keep attention on a developing question.
The design keeps that personal attention apart from shared customer policy, and promoting a watchlist item into the shared register takes an explicit review.
These features connect the SOC with the customer teams who know how their systems are used.
An infrastructure owner can verify a rollout.
An identity team can explain a recovery.
A business owner can clarify what an outage would cost.
Their input should be attributable, and limited to the question they can actually answer.
The wider plan separates three views: a customer view for current investigations and business context, a personal view for assignments and followed entities, and a portfolio view for leads working across the customers they are permitted to see.
Differences in source coverage and workflow readiness have to stay visible when workloads are compared.
Turning investigation knowledge into reusable workflows
We are designing a workflow library that makes good investigation approaches repeatable across customers, while keeping each customer's boundaries intact.
A workflow describes the activity it examines, the data it needs, the identity relationships, the possible comparisons, the verification questions, the permitted checks and the conditions for stopping.
It also explains its own limits, and how an analyst should read its results.
Three statuses stay separate.
Has the workflow content been reviewed?
Are its checks implemented?
Does this customer have the data and configuration to use it?
A published description does not prove execution capability, and an executable workflow can still be unavailable in a given environment.
Adopting a workflow means choosing a version, binding approved sources, validating required fields, setting permitted parameters and budgets, and testing the result.
Source bindings and customer identities stay specific to each environment, even when the method is shared.
Over time, this approach could cover more identity, privileged access, service account and data movement questions.
Workflow authoring, richer testing and governed updates remain part of the future capability.
Built for the QRadar environment
Risk Observatory is intended for the QMasters SOC and for customer teams who run QRadar.
It reuses our existing QRadar connection and supported query client, with local processing and retained investigation state.
The current pilot runs on a lightweight stack of Flask, browser JavaScript and SQLite.
Its processing is deterministic, and the approach we adopted does not depend on an external AI service.
Analysts need to see which evidence and which rules contributed to an assessment.
Operating cost is part of the design.
Opening a dashboard reads retained state.
Retrieving more customer evidence is a deliberate action, with an explicit scope, time window and execution budget.
Partial results, timeouts and collection limits stay visible.
Scheduling or historical backfill would need their own operating policies and capacity validation.
Moving processing into the application does not remove the cost of searching the underlying QRadar environment.
Customer isolation is just as central.
Similar account names, private addresses or domain numbers must never merge evidence across environments.
The shared product needs identity, access and action permissions enforced on the server, including protection for private watchlists and notes, and those controls have to be in place before broader use.
Where it stands and what comes next
So far the work has established the product rationale, detailed user journeys, a local investigation pilot and the chosen combined interface.
The pilot supports retained observations, provenance, separate assessment dimensions, revisions, next checks and explicit bounded collection for the first identity investigation.
The new interface demonstrates the broader experience: the observation and entity dashboards, investigation steps, shared business context, personal watchlists, workflow discovery and operational views.
It is a design reference that uses fictional data, and it is not evidence that every corresponding production service is connected.
The path forward is to join the chosen interface to the supported investigation model, validate field mappings and source semantics, and expand capabilities as their prerequisites become reliable.
Shared business context, trusted authorization evidence and endpoint context each need an explicit integration contract.
Historical comparison needs coverage that is sufficient and understood.
Broader team use also needs work on roles, collaboration, conflict handling, retention, recovery and operating capacity.
Workflow expansion and automation under policy come after the underlying evidence and execution controls are validated.
This is a development direction, not a dated release commitment.
The immediate priority is an investigation an analyst can inspect, understand and safely continue.
What success will mean
We will judge Risk Observatory by the quality of the work it helps analysts finish.
Do they understand what happened?
Can they explain why it matters?
Do they know which evidence is missing?
Can they choose a justified next action?
The pilot will also measure the effort it takes to gather context, the usefulness of the verification questions, the quality of explanations and handovers, and the query and storage cost of keeping investigations alive.
A supported legitimate explanation and a well defined unresolved outcome both count, alongside the findings that justify escalation.
The capability we are working toward gives QMasters and its customers one consistent place to follow a security question from its first observation to a reasoned decision.
Every important conclusion stays connected to its evidence, its scope and the conditions under which it may need to change.
Explore QMasters, our QRadar expertise, and StrongHold MCSS for the operational context behind this work.
If you run QRadar and want to talk about the activity your rules never flag, talk to our team.
FAQ
Frequently asked questions.
Risk Observatory is a capability QMasters is developing to help its SOC and its customers investigate activity that deserves attention, including activity that has not produced a QRadar offense. It brings the observation, the affected entities, the available evidence and the next useful check into one investigation that develops as evidence arrives. It is in active development, with a local investigation pilot and an interactive design prototype, and it is not yet a released service.
An offense records that a rule fired. Risk Observatory starts from an observation that may never trigger a rule, such as a sensitive identity change or a service account reaching new machines, and asks whether a legitimate explanation or abuse fits the evidence better. It keeps impact, confidence in abuse, evidence coverage, authorization, review priority and disposition separate, and it preserves why a conclusion changed.
The pilot's processing is deterministic, and the approach we adopted does not depend on an external AI service. Analysts need to be able to inspect which evidence and which rules contributed to an assessment.
A crown jewel register is a customer maintained record of important assets, identities and services, with the reason each one matters, its technical identifiers and an accountable owner. In Risk Observatory it is intended to shape how the potential impact of an activity is read, while staying separate from the confidence that the activity was abusive.
Risk Observatory is a development direction, not a dated release commitment. The immediate priority is an investigation that an analyst can inspect, understand and safely continue, and pilot use and analyst feedback will decide how it expands.
ABOUT THE AUTHOR
Practitioners from the QMasters Security Operations Center. We run 24/7 monitoring, detection engineering, and incident response for organisations across regulated industries — and write here from the offense and defense work in front of us.